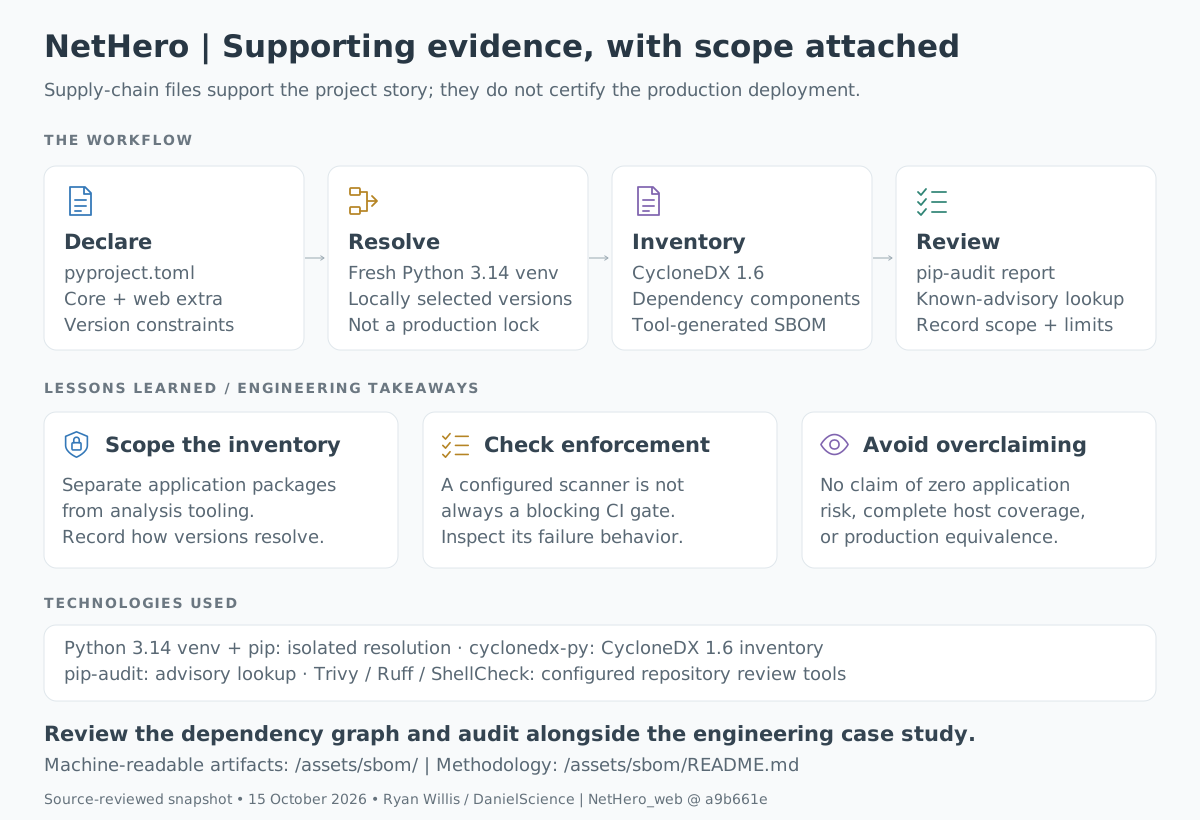
A phone call can connect and still have no audio. The system has completed the steps needed to set up the call, but the voice traffic may not be reaching both people.
NetHero’s web packet-capture analyzer helps investigate that kind of problem. It reads recorded network traffic, identifies calls, and produces a report that brings the findings and their evidence together. I want an engineer to be able to check the explanation, not just accept a warning on a screen.
What an investigation looks like
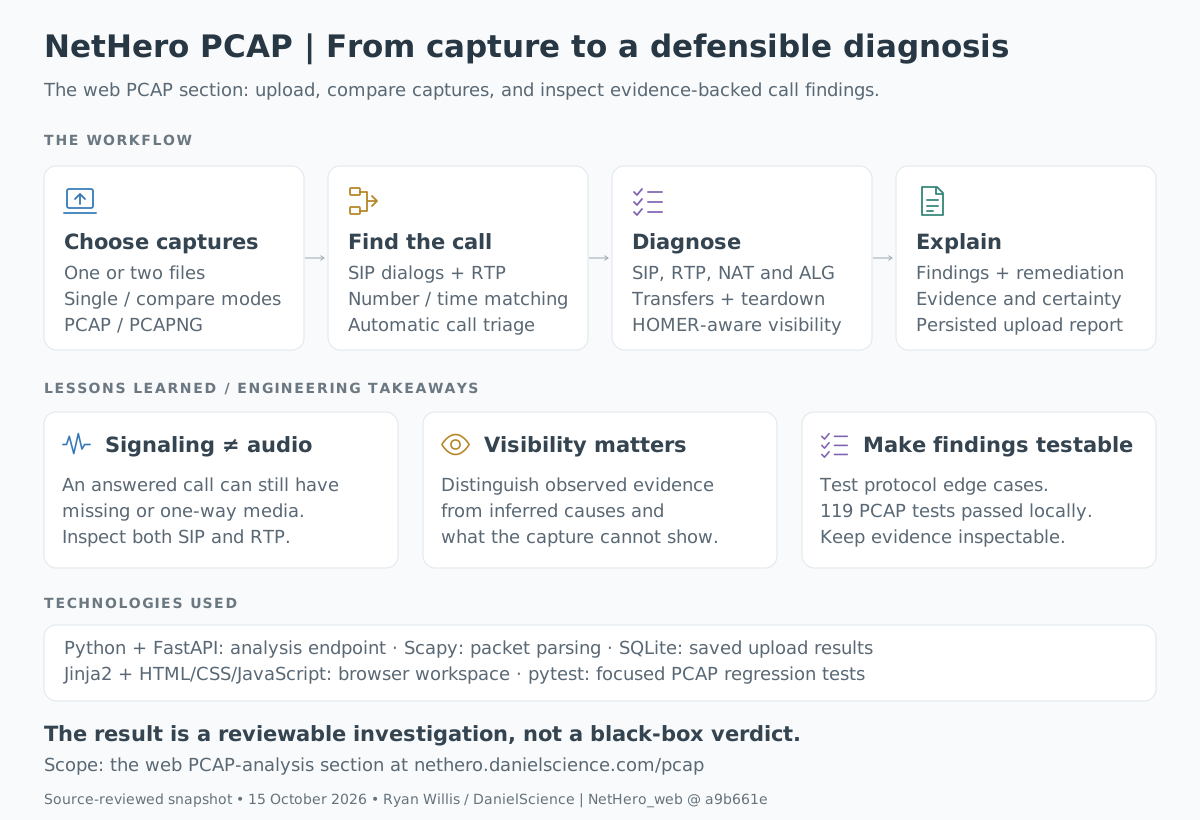
A packet capture is a recording of network traffic from a particular point in the network. In NetHero, the user can upload one capture or compare two, such as a working call and a problem call.
Call details, including number and time, help narrow the search. The report then brings together the matching calls, detected issues, supporting evidence, and suggested next steps.
For someone handling a service problem, the useful question is straightforward: what should we investigate next? For the engineer doing that work, the report needs enough detail to explain why.
Separating call setup from audio
The analyzer looks at both SIP, the signaling used to set up and manage a call, and RTP, the traffic that carries its audio. A successful SIP response alone does not establish that audio traveled in both directions.
The checks cover call setup failures, missing or one-way audio, packet loss, timing variation, transfers, and call teardown. They also look for evidence involving address translation and devices that modify signaling along the way.
Comparison mode adds context. A known-good capture can help an engineer see how the problem call differs, rather than treating every file as an isolated investigation.
What a capture cannot tell you
Capture placement matters. If the recording contains signaling but no audio traffic, that does not automatically mean the call had no audio; the recording point may simply not have seen it.
NetHero includes checks for that limitation. Its HOMER mode, used for captures from a call-monitoring system, suppresses a group of media findings when they would rely on traffic that is not visible.
Each finding can distinguish a directly observed event from an inference, an unconfirmed possibility, or something the capture cannot show. Timestamps and display filters help an engineer return to the relevant packets.
That distinction matters during an escalation. “We did not capture audio traffic here” and “the endpoint received no audio” are different claims and lead to different next steps.
Engineering details
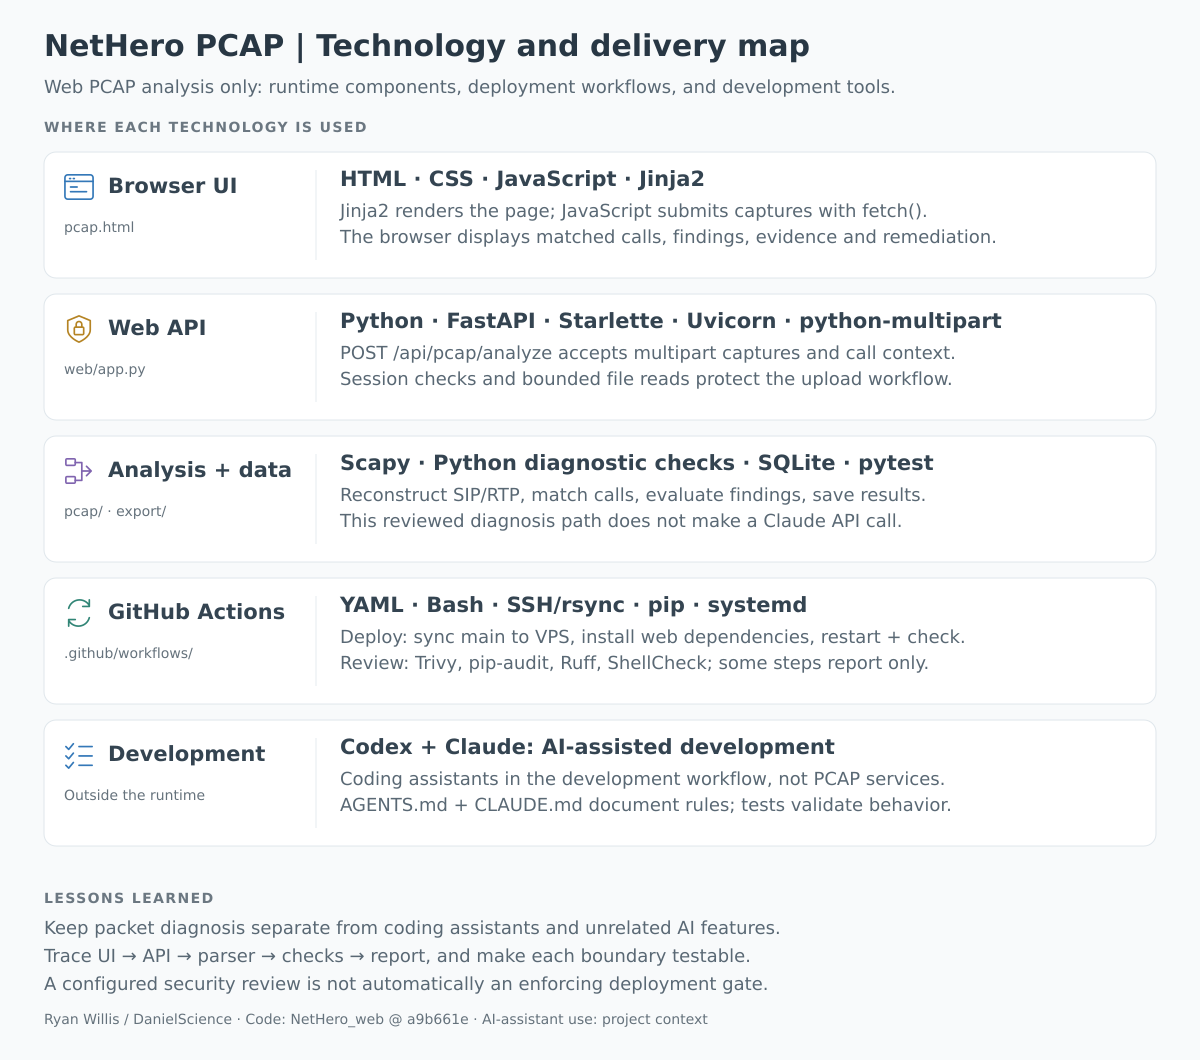
The browser handles the upload and report display. Python handles the packet parsing, call matching, and diagnostic checks on the server.
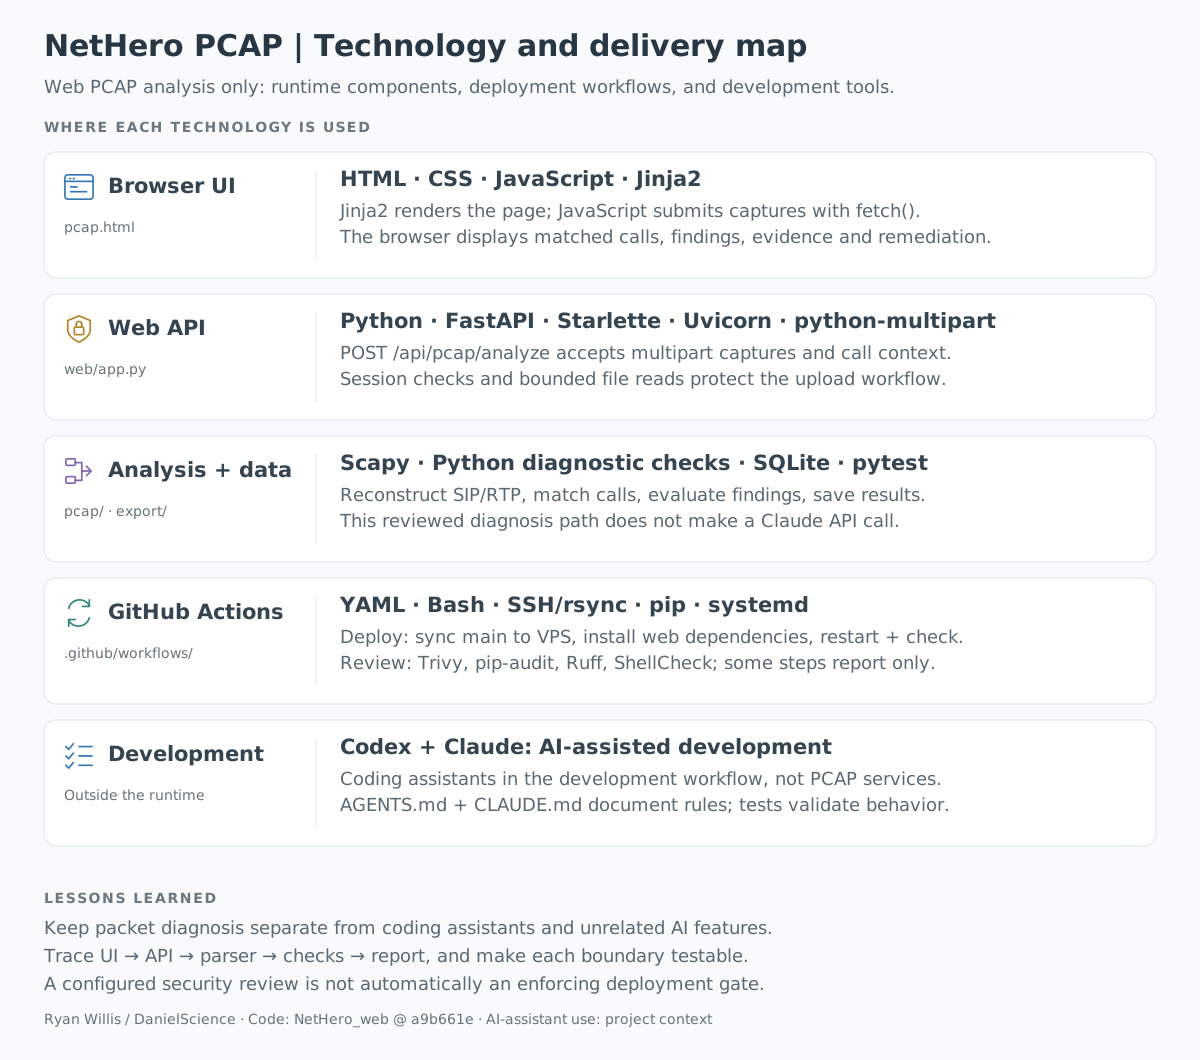
- Browser interface: HTML, CSS, and JavaScript provide the workspace, with Jinja2 templates for the page. JavaScript sends the upload to
POST /api/pcap/analyzeand displays the returned report. - Server and analysis: FastAPI runs on Uvicorn, with Starlette session handling and multipart upload support. Scapy reads packet data, custom Python checks evaluate the calls, and SQLite saves upload results.
- Tests and delivery: Pytest checks PCAP behavior. GitHub Actions uses YAML and shell commands for deployment and security review; SSH and rsync transfer code to the server, where systemd manages the application service.
The full source is private. This selected map shows the main files involved in the PCAP feature:
src/callsentry/
  web/
    templates/pcap.html
    app.py
  pcap/
    parser.py
    analyzer.py
    checks/
    schema.py
tests/test_pcap_*.py
app.py handles the upload endpoint and session checks. parser.py turns packet data into calls and media streams; analyzer.py matches calls and runs the checks. schema.py defines the findings passed to the report.
These selected fields show how the finding keeps evidence and certainty together. Other fields are omitted:
@dataclass
class PcapFinding:
    check_id: str
    title: str
    severity: str
    category: str
    description: str
    evidence: list[str]
    certainty: str = "UNCONFIRMED"
The upload route requires an approved session and limits how much data it reads. Temporary parsing files are removed even if parsing fails, and saved results keep the findings available for review.
The deployment workflow installs dependencies, restarts the service, and checks a local health endpoint. A separate security workflow runs Trivy, pip-audit, Ruff, compilation checks, Docker Compose validation, and ShellCheck. Some checks report problems without blocking deployment, so this is not an all-or-nothing security gate.
I use Codex and Claude as coding assistants, with project instructions covering evidence, secrets, and tests. The PCAP analysis path itself does not call either model; it runs the parser and diagnostic rules.
What the tests show
A focused local run of five PCAP test files completed with 119 tests passed and four warnings. That is useful evidence about the tested behavior, not a full-application coverage result or proof of how every deployment behaves.
The remaining limits are practical ones: encrypted traffic, parser assumptions, capture placement, and gaps in the checks can all affect the result. The report is a starting point for investigation, not a replacement for inspecting the traffic.
Lessons learned
The most important lesson is to be precise about what was observed. A tool that confuses a missing view of the network with a network failure can send an investigation in the wrong direction.
- Check setup and audio separately: A connected call does not prove that voice traffic reached both sides.
- Keep the evidence with the finding: Another engineer should be able to follow the result back to the packets.
- Test the awkward cases: Missing traffic, incomplete captures, and protocol edge cases matter as much as a successful upload.
The project’s value is in bringing those checks into a repeatable investigation of internet-based phone calls, or VoIP. It has a narrower job than a general-purpose protocol analyzer, and the report needs to be clear about where that job ends.
Diagrams and dependency notes
Download the workflow PNG or technology-map PNG. Editable versions are available for the workflow and technology map.
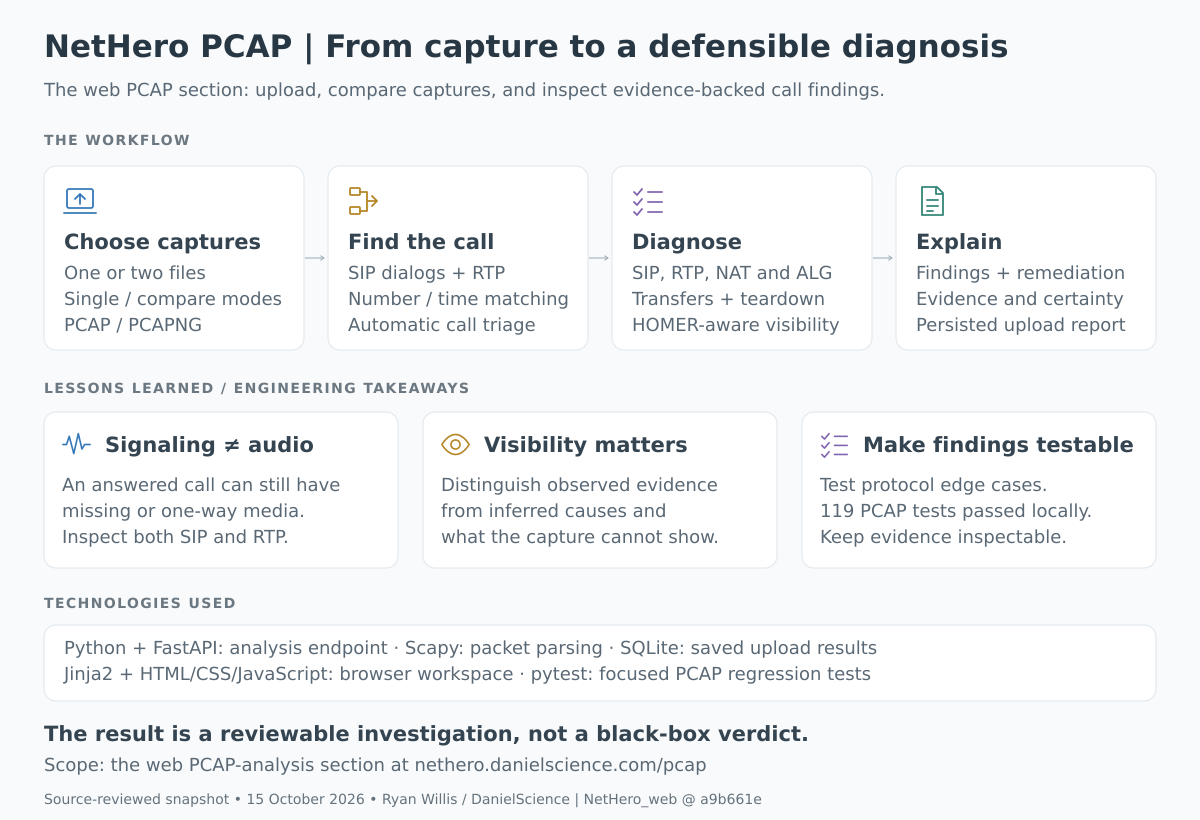
The software bill of materials lists dependencies from a local review installation, not the production host. The audit report, review notes, and supply-chain diagram provide the supporting detail.